In Star Trek humans live in a post-scarcity world. Transporter technology allows for instantaneous and cheap movement of humans and objects anywhere on a planet, and into or out of orbit. The same devices that allow for transportation can also re-organize matter into arbitrary configurations. This means that anything that can be designed can be owned for essentially no cost. What do people do in such a world? As Gene Roddenberry imagined, they explore. If we can get anything that’s ever been recorded for free in an instant, then new and undiscovered things are of unparalleled value and interest.
The programmer internet is polarizing over ChatGPT. Some claim that it is nearly AGI, some claim it cannot do anything of value, with plenty of people in between. I’ve worked with GPT-3 professionally, used CoPilot for over a year, and recently started programming side-projects with the assistance of ChatGPT (I pay for GPT-4 access). I’m considering working with LLMs full time again, so I pay close attention to what the GPT models can actually do.
This is written in response to this post from David Rozado.
Results
I ran the political compass quiz against ChatGPT 3 times to make sure its political compass alignment is consistent. After three tests it seems to be be pegged well into the Left/Libertarian quadrant.
After more than 12 years, BaconBits, the unofficial Reddit torrent tracker, has shut down for good. It’s terrible to see such a solid community disappear.
On many torrent trackers users are able to request specific content to be uploaded. As of BaconBits’ final hours, the request fill ratio stood at 89.28%. A dedicated community member would provide almost anything you could ask for. For a site that never had more than 6000 users, that’s quite a feat.
One year ago I looked around for existing tech that would provide me with compile-time guarantees for a REST-ish API interface. With full-stack TypeScript web applications reaching a level of maturity where I, a previously die-hard Rails developer, felt comfortable taking the dive - it seemed like the Node ecosystem was lacking in ties between the front end and back end.
What is BrainFuck? BrainFuck is an esoteric programming language designed specifically to be easy to compile. The environment provides the programmer with an “infinite” array of bytes (traditionally just 30,000) and a data pointer. There are only 8 single character commands:
A common riddle-like question for programmers asks them to swap the values of two integers without a temporary intermediate value. There are two common solutions that I’m aware of, addition swap and XOR swap. Here’s what each looks like in C:
Shaders provide programmers with a beautiful combination of art and math. Most other throwaway projects are devoid of any artistic value. In less than a dozen lines of code you can draw fractals. A few more and you can start creating intricate animations. The most interesting part is the unique perspective they force you into.
Say you want to draw a circle in an imperative programming language. You need to break out a for loop and calculate the sin and cos of different angles until you have points all around the circumference of a circle.
The intention is to force myself to get a small taste of a bunch of new programming languages and programming paradigms. Since I was late to the party I rushed through the first 4 problems in languages I’m familiar with. But for day 5 I solved the daily problem with MIPS assembly. I look forward to learning and writing Common Lisp, Haskell, Prolog, and many more languages.
One hope I have is to complete a problem in GLSL. I’m already somewhat familiar with GLSL, but given its intended purpose it should be a true feat if it works.
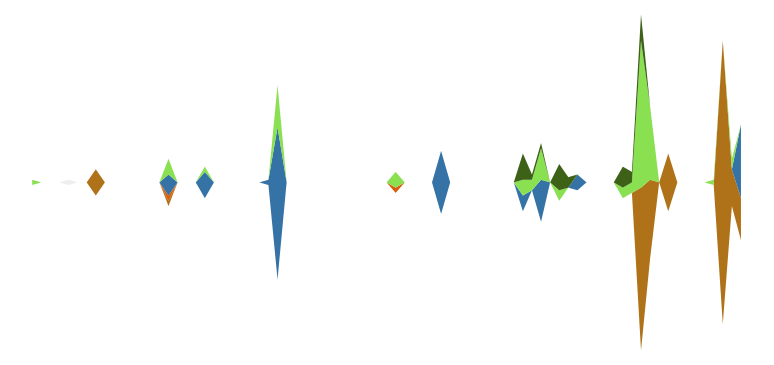
After a stroke of inspiration earlier this evening I hacked together this tool. It produces a stacked time-series graph of GitHub commit data. The commit data is organized by language and uses the same colors as GitHub for each corresponding language.